Module: Interdependent Relationships in Ecosystems
DCI: LS2.A Ecosystems have carrying capacities, which are limits to
the number of organisms and populations they can support. These limits result
from such factors as the availability of living and nonliving resources and
from such challenges such as predation, competition, and disease. Organisms
would have the capacity to produce populations of great size were it not for
the fact that environments and resources are finite. This fundamental tension
affects the abundance (number of individuals) of species in any given
ecosystem.
PE: HS-LS2-1 Use mathematical and/or computational representations
to support explanations of factors that affect carrying capacity of ecosystems
at different scales.
PE: HS-LS2-2 Use mathematical representations to support and revise
explanations based on evidence about factors affecting biodiversity and
populations in ecosystems of different scales.
[Clarification
Statement: Emphasis is on quantitative analysis and comparison of the
relationships among interdependent factors including boundaries, resources,
climate, and competition. Examples of mathematical comparisons could include
graphs, charts, histograms, and population changes gathered from simulations or
historical data sets.] [Assessment Boundary: Assessment does not include
deriving mathematical equations to make comparisons.]
[Clarification
Statement: Examples of mathematical representations include finding the
average, determining trends, and using graphical comparisons of multiple sets
of data.] [Assessment Boundary: Assessment is limited to provided data.]
The ideas in this standard are:
- ecosystems have carrying capacities (limits to the number of organisms and populations that the ecosystem can support)
- the limits are the result of certain environmental factors (availability of resources and other challenges to the population.)
- If it weren't for these limits on population sizes, the population size would grow without restriction.
- the tension that results from the limits on resources affects the number of individuals of species in any ecosystem
The first PE says that we should use mathematical or computational representations to explain how different factors affect an ecosystem's carrying capacity. This is made clearer by the clarification statement, which tells us that we can use graphs, charts and histograms in order to make mathematical comparisons. We do not have to provide any kinds of equations for students to use in order to make explanations.
Additionally, the second PE asks us to use mathematical representations. Again, that is made clear by the clarification statement which says to find the average, trends, or make comparisons of data sets. We can not expect students to know how any one single population has changed as a result of carrying capacity, but we can provide data and have them analyze it.
Possible Question Starters:
I stole this picture from the internet - we will have to replace. I'm picturing something with only the line showing the changes to the population. But, we can ask something like this...
"The graph shows how the population of _______ changed between the years of 1800 and 1925.
Based on the information in the graph, we can conclude that the carrying capacity of the ecosystem for this organism was around _____?"
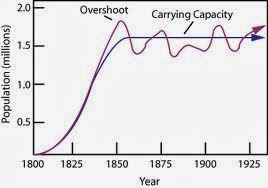
Correct answer - 1.5 million
I stole this picture too. We can come up with something similar.
Basically, it's just a concept map. We can label a much more simplified version and ask "which of the following would be the best replacement for the letter X in the diagram?"

No comments:
Post a Comment